

Is data visualization really that important? Or is it just another buzzword for tech geeks with doubtful return on investment?
According to the Markets and Market report, the global market for data visualization tools is forecasted to grow at a 5-year CAGR of 11.6%, from $5.9 billion to $10.2 billion as of 2021.
There’s also a long history of major players investing in data visualization tech. Salesforce.com, Inc, a publicly-traded company behind one of the most popular CRMs in the world, bought a data visualization software tool called Tableau in 2019 for $15.7 billion.
IT giants like Amazon also keep their fingers on the digital pulse. Amazon’s QuickSight tool provides a ML-powered business intelligence platform that is capable of translating every figure in its database into a readable visualization.
What Is Data Visualization?
Data Visualization is an umbrella term that covers a range of techniques and practices used in software development that transform digital data of any size into a compact visually comprehensive form like a graph or map. Data visualization helps users process complex financial and technical information, spot the trends and pinpoint threats quicker and with less mental effort.
Not all data translated in the picture or chart is easily digestable. There are rules and guidelines for how to highlight specific trends and data sets which help business analytics to ensure a clear and comprehensive visualization.
The Importance of Data Visualization
If you had a chance to run your company with or without a data visualization module, why would you consider the former?
Out-of-the-box solutions allow even small and medium businesses to enjoy the advantages of data visualization software. However, if you have 4 or more senior managers on your team and/or $500K+ in investments, getting a data visualization tool is a must.
Take Advantage of the Psychology of Cognitive Processes
A human brain is capable of processing visuals 60,000 times faster than text.
Consider this classic example of the benefits of visually-processed data:
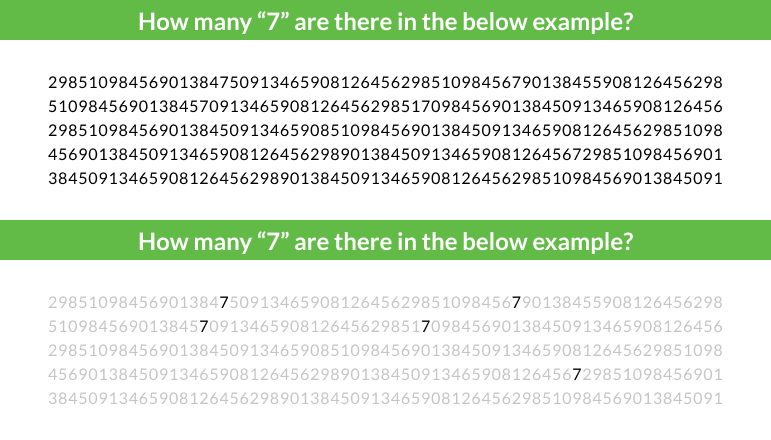
It’s much easier to identify the numbers in the second image, right?
According to the Harvard Business Review, 21% of a CEO’s day is spent on strategic decisions. This aligns with the Pareto principle. This way visualized data helps ease this wall-bearing part of the day and precipitate the strategic decision-making.
Look Professional to Stakeholders
Excel is an excellent tool for presenting to stakeholders. But a sleek chart or graph looks much more professional and up-the-speed.
Monitor Major Key Performance Indicators Daily
Some data is auxiliary to business processes and some is critical for survival.
Most of the reporting tools with visual dashboards will have vital KPIs on the first page, so you always have the ability to address critical situation timely.
One of Dev.Pro’s clients helps restaurant owners manage their daily business operations with a software application that has a data visualization module as its integral part.
The team used Vega and D3 technologies to implement reporting needs in a visual format.
This reporting was accessible on mobile as well as on desktop, which is vital in an industry as fast-paced and unforgiving as the restaurant business.
Restaurant owners and regional franchise managers can check sales, average check and covers per each outlet, but the data can also be synced with the purchasing and manning modules, which ensures timely refill of inventory and proper manning.
Onboard New Team Members Quickly
New employees are humans too. They also like comprehensive images with trends, and illustrated trends.
Onboarding is easier when you provide your team with uniform, easy-to-read tools for their daily business analytics needs.
Minimize and Eradicate Looming Threats Using Early Detection of Downward Trends
One of the benefits of data visualization is its power to alert you to a looming disaster at times when the damage can be undone or minimized.
Visual graphs allow you to identify the patterns and dig further to find the underlying reasons for them. If the patterns are consistent with the operational and marketing efforts and spends, it’s a sign for management that they are on the right track.
Enable Cross-Channel Accessibility and Mobility
Many popular data visualization tools – if out-of-the-box or custom-made – are accessible on mobile phones, too. SAP, Microsoft Power BI, Tableau, Sisence — all major data visualization software solutions have a cloud-based mobile device access to its dashboards.
This is useful not only for professionals who travel a lot, but also for those who spend working days in the fields like construction site managers or consultants.
Dev.Pro received overwhelmingly positive feedback about a reporting dashboard that clients of our partner use in the restaurant industry. They get access to a nearly real-time KPIs dashboard on their smartphones as the software sources its data from points of sale in each outlet.
Get Real-time Monitoring and Alerting
Even though the major function of the data visualization tools is for financial, marketing purposes, operations and other departments will also use these dashboards for their unique scope of work.
If a warehouse is running out of a specific best selling item, a replenishment module should trigger an alert, which will prevent loss of potential revenue.
Source of Insights for Market Status Quo and Prospects
Any business’s success depends on internal and external factors with market evolution and dynamics being a decisive aspect. The importance of data visualization in business intelligence is incomplete without one major piece of the puzzle: market knowledge and analytics.
A visualization of market data as a whole and a specific business’s place within that offers a birds-eye view of the market.
Market share, pricing, user acquisition, and social media are just a few data points that help a business keep a well-rounded perspective of causes and consequences.
The Benefits of Data Visualization: Charts, Graphs and Maps For Biz Dev
The benefits of data visualization in business intelligence far outweigh any potential challenges.
On the surface, there are two major issues:
- The investment into the development of a data visualization tool, and
- The learning curve for team members who need to run and use the tool
Once the software is integrated and the team is trained to use it, the benefits of implementation come out.
As for the learning curve, practice makes perfect Users tend to find graphs easier to interpret and act on than figures.
Investing in business intelligence tools can yield an ROI of 1300%, meaning that every dollar spent on these tools brings $13.01 in return.
Below are a few examples of how businesses in various economic segments utilize the power of visualization tools:
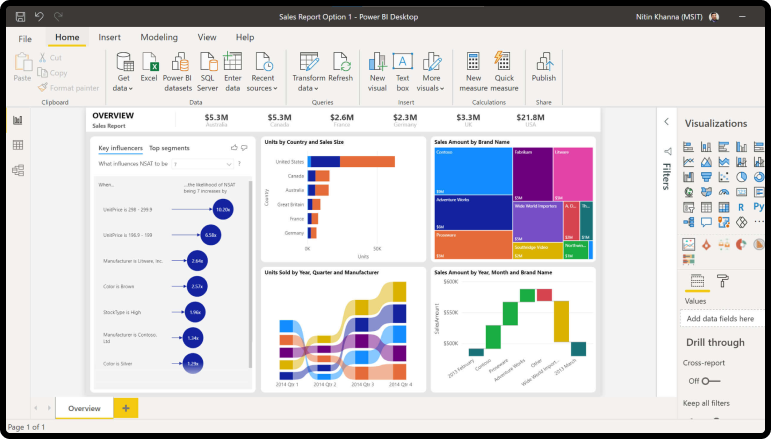
- Enlighten Design uses Power BI to produce colorful infographics for their clients:
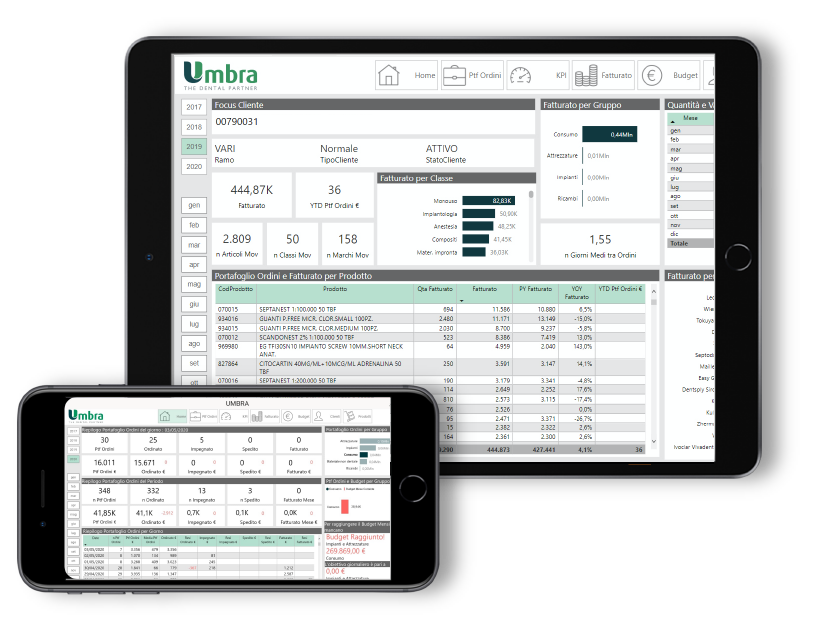
2. Instante helped their customer Umbra spa, a dental clinic supplier, to integrate a more collaborative process across organizations with multi-channel real time visibility of business processes for all major stakeholders.
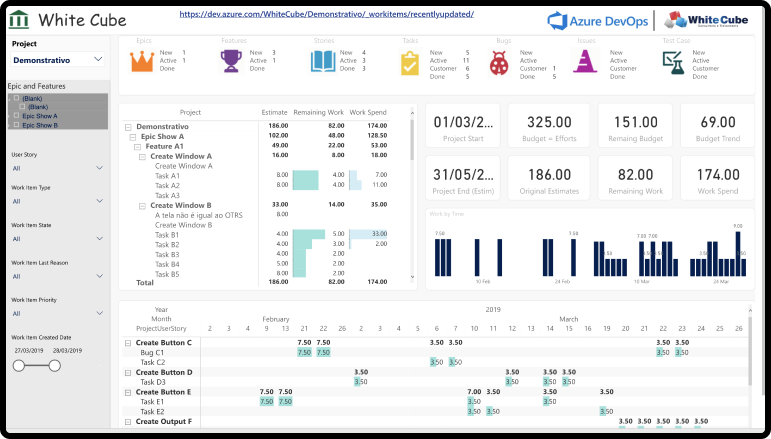
3. White Cube integrated Power BI with Azure DevOps for better visibility and real-time monitoring.
The out-of the box solutions available on the market allow businesses small and large to find the right data visualization tools for their needs. There are even some free versions for personal use, like SAP Lumira, that can give you a taste of data visualizations.
Why Your Business Needs to Start Taking Advantage of Data Visualization
The importance of data visualization is probably only appreciated by those using it on a daily basis.
Out-of-the-box tools are a good fit for smaller businesses, while enterprise clients will require some level of customization and integration.
Custom-made tools offer better security for your confidential data, while specifically designed data sets delivered to the respective stakeholders at the right time according to their needs, guarantee no clutter of functions you don’t use and easy scalability. Moreover, tailor-made tools are easily customizable to your business needs, allowing you to include pagination, localization, internationalization, and other non-common blocks.